Let's start off with, that we shall understand what is debugging the program and discuss why and when to use a debugger.
Debugging programs – this is the stage of development of the programme, in which the programmer looks for and removes all kinds of code errors. In particular, we are interested in errors, that occur at run time, rather than at compile. They can lead to serious problems and failures of the program, discover the cause of which is not easy.
Sometimes, to find the error and see, which leads to it, it is necessary to pass any piece of code step by step, on which the program is held at the time of execution.
It is also interesting to see, in this case the program change data (the values of the variables): what values they take at certain points in time. In Microsoft Visual Studio for the job, fortunately, there debugger. This article will review the basics of working with the debugger.
Let's, it is necessary to analyze and debug the following code:
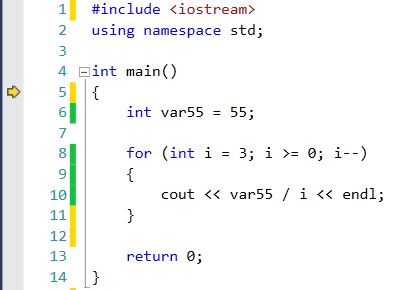
1 2 3 4 5 6 7 8 9 10 11 12 13 14 | #include <iostream> using namespace std; int main() { int var55 = 55; for (int i = 3; i >= 0; i--) { cout << var55 / i << endl; } return 0; } |
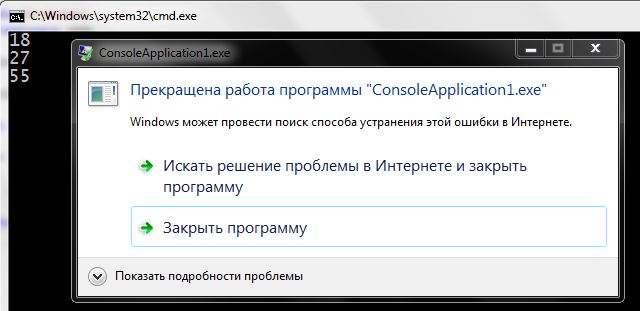
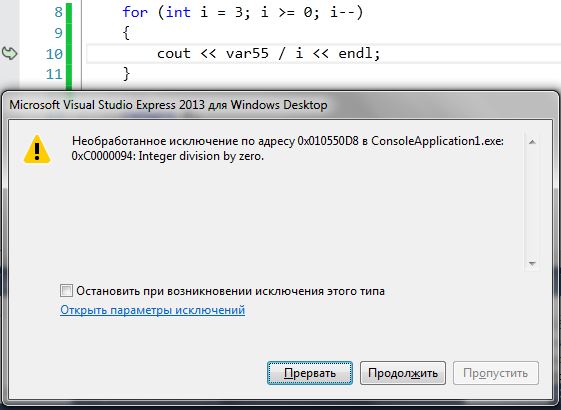
Dial it in Visual Studio. In this code, there is no syntax errors, that missed would be the compiler prior to start of program execution. The program starts, do some site work and an error:
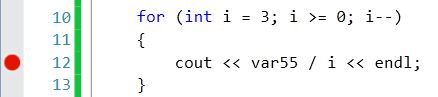
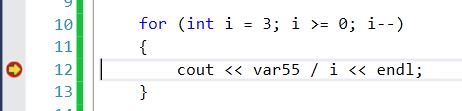
 Start debugging and see, in consequence of which there was an error at runtime. For this, while in Visual Studio, it is necessary to press F10. The program will begin to be executed and stops at the first executable string. You will see a yellow arrow near the string, which is currently running:
To go to the next step, you should click again on F10. The yellow arrow moves to the next string:
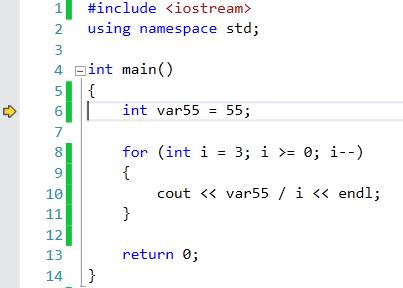
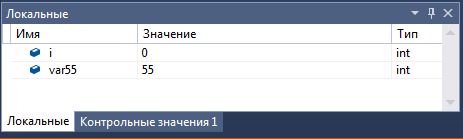
Now look down the screen in Visual Studio – there is a tab where you can monitor, how are data variables in real time.
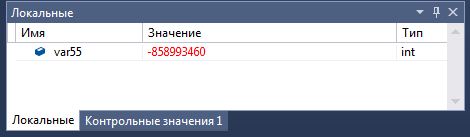
Here variable only creates and stores some rubbish. The next time you click on the F10arrow moves to the string 8. In the tab is already visible, the variable i is declared, as well as the importance acquired variable var55.
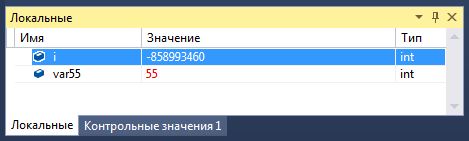
Press the F10 and look, how to change data. When you pass the fourth time debugger on a loop, the variable i will take the value of 0. This then leads to a runtime error program as 0 can not share.
To exit the debug mode – pressShift F5. If the code is big and you need to debug it with a given string, and not from the beginning – simply place the cursor in the desired string and pressСtrl F10.
The breakpoint (breakpoint) and Smart breakpoint
On site msdn there is the definition of breakpoints:

If you need to run the program until a certain place in the code, and only reached its, run a debugger – use a breakpoint.
1 2 3 4 5 6 7 8 9 10 11 12 13 14 15 16 17 18 | #include <iostream> using namespace std; int main() { int var55 = 55; cout << "Start!\n"; for (int i = 3; i >= 0; i--) { cout << var55 / i << endl; } cout << "Finish!\n"; return 0; } |
To set a breakpoint on the string cout << var55 / i << endl; , place the cursor in front of it and press F9. After that you will see this string near the red spot – this is it.
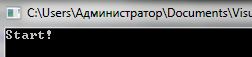
By pressing now the key F5, program starts, executed up to that string, where we set a breakpoint on and the debugger.
The console will display the, that has run to 12-th string.
 Then you can debug the program, as before – pressing F10 and watching variables. Everything that is done in the program, will be displayed in the console. To remove a breakpoint – it is necessary to put the cursor on the line where it is located and pressF9
If, for example, iterations is not 3, as in this code, and 333 and we see, that the error occurs at the last iteration, don't really want to go through all these steps loop debugger? It is possible to skip, let us say, 330 iterations, and analyze only the last 3. For this we use a smart breakpoint. First, copy this code:
1 2 3 4 5 6 7 8 9 10 11 12 13 14 15 16 | #include <iostream> using namespace std; int main() { cout << "Start!\n"; for (int i = 0; i < 333; i++) { cout << i << endl; } cout << "Finish!\n"; return 0; } |
Now set a breakpoint usual (F9) and click the right mouse button. This will open a drop down menu with additional options for it.
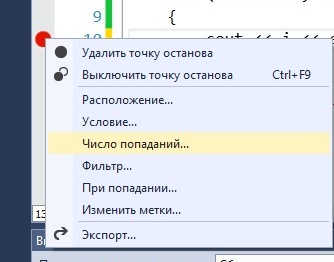
To execute the program up to the 330-th iteration and go into debug mode, Select the number of hits.
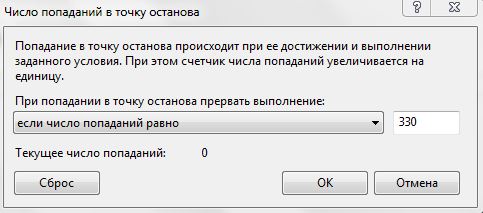 Now select “if the number of hits is equal to”, I am writing 330 and click OK. At the breakpoint will be white +. It means, that it has additional terms. Push F5, to run the program. She pauses and goes into debug mode at 330 iterations (330-m contact with a breakpoint). Next is pressing F10 We pass through the loop until the last iteration.
These are the main, but not all of the debugger Microsoft Visual Studio.
>> These are the main, but not all the features of the debugger Microsoft Visual Studio. Over time and examine other.
I, of course, I do not know, that there is still room for the studio there. But I think the article does not mention enough about the call stack and calculated values (on one of the pictures you have seen tab – “control values” – it is like).
About the call stack can be an example of a recursive function to tell, I think. You just recently tried to reveal the topic of recursion :).
I would not get hung up on the studio – in other environments same, They differ only in name and location of windows…
You could generally write about debugging – well, for example, because you can strategically set cout and thus find a place in error )). At least, is convenient IDE does not appear – well done, and even now it is sometimes more convenient. The standard library has a special flows clog and cerr, which can juzat cout instead of to standard output not clog nonsense (But even they can be redirected somewhere). In Qt library has QObject method::qDebug() allows you to display debug messages to a special debugger window.
“Now look down the screen in Visual Studio - there is a tab where you can monitor, how to change variable data in real time.”
and if there is no such tab, how to open?
Debugging ->Debugging further Debug- again> WINDOW->LOCAL
Thank you, I haven't been able to find this one for a long time.